AquisNet SYS/REP (NEW)

|
Classification |
Scroll
 | |
|
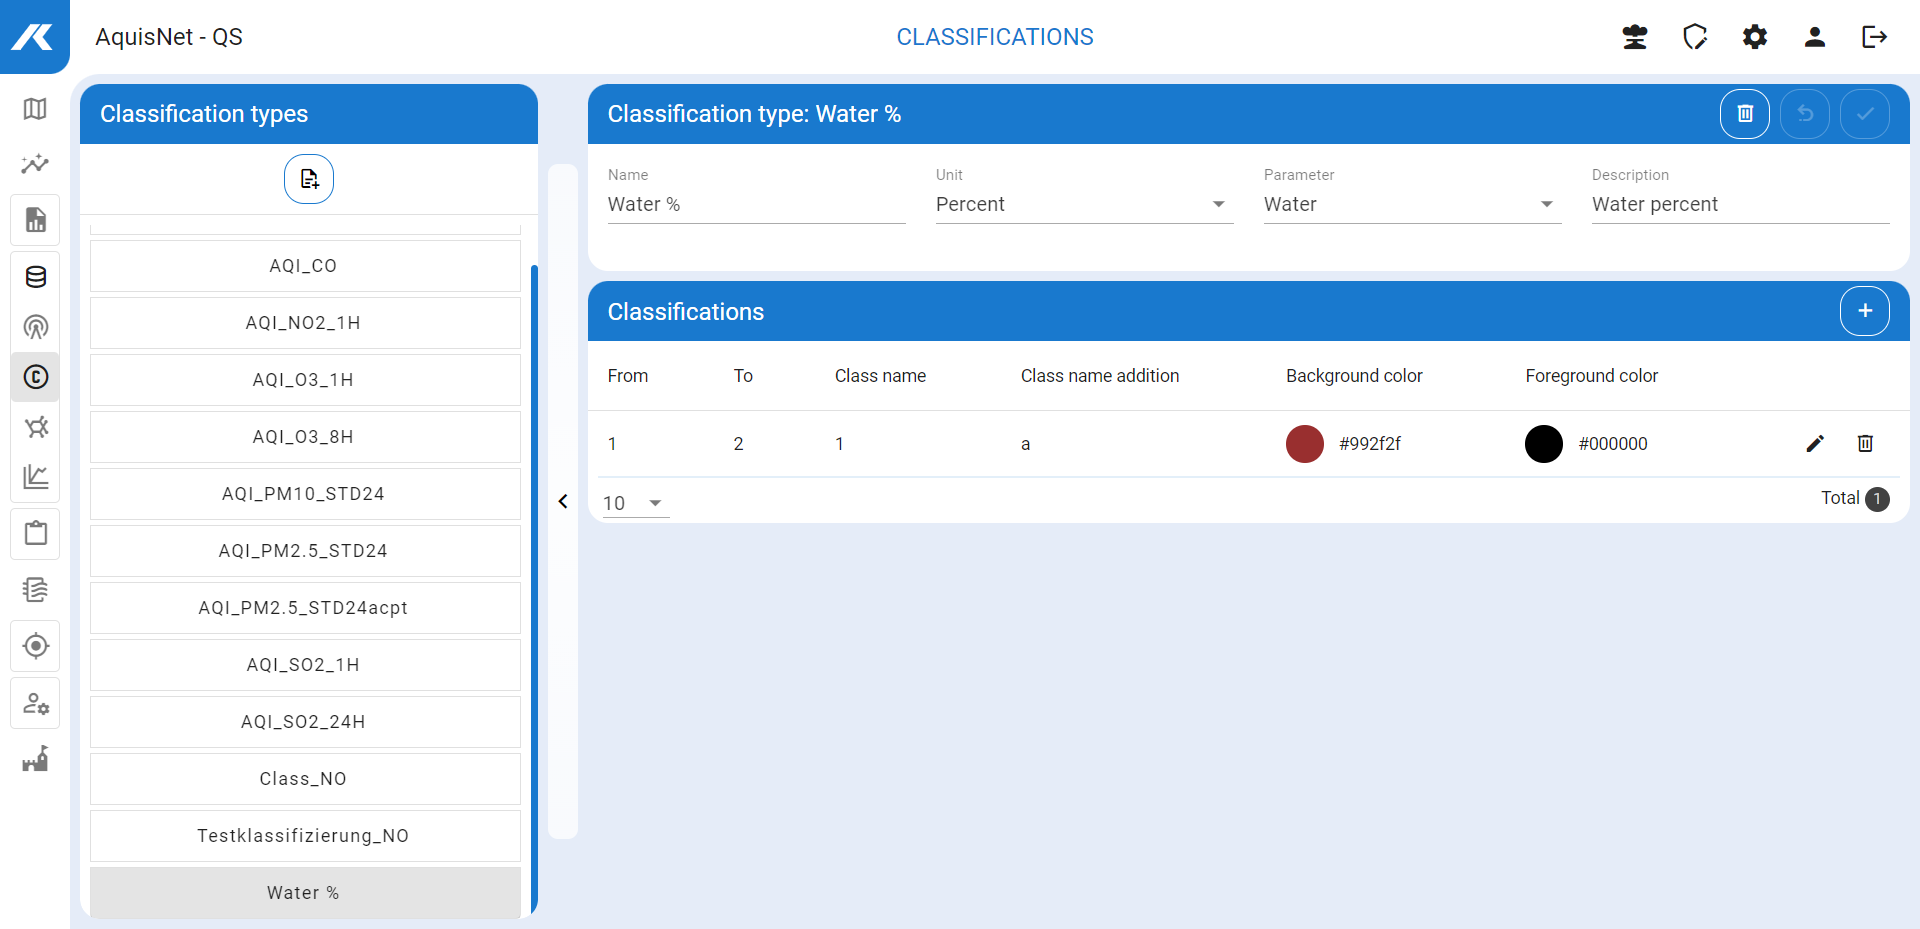
You can assign measured values of time series to quality levels (very good, good, etc.) under the link Data management > Classifications. The measured values are checked against the limit values of a quality level and classified accordingly.
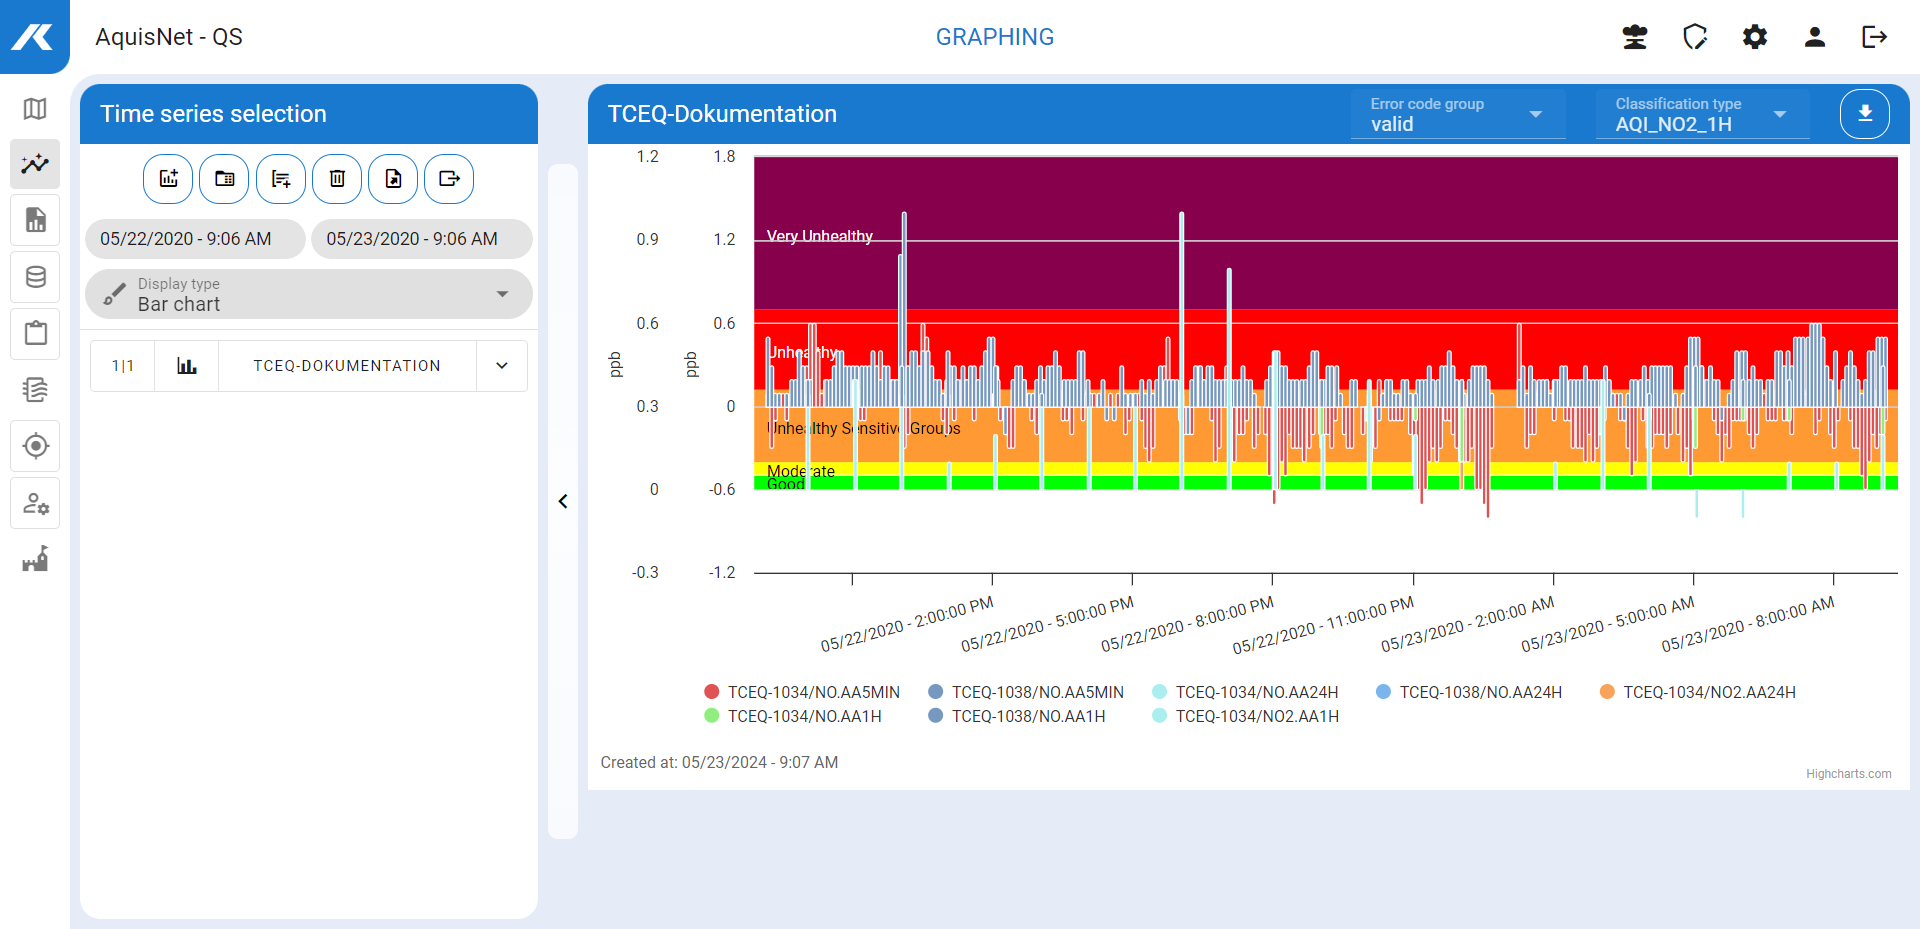
Classifications are assigned to classification types and selected from a drop-down list box in the graph display (see Configuring Graphical Display).
Note:
▪Only the classifications whose assigned parameter or unit matches the selected time series are available for selection.
▪If no classifications are stored in the system, the entire section is not offered.
▪Classifications can also be used in the various display types to configure the graphical display.
▪The selected classification scheme is implemented in the table report by colouring the table cells according to the class configuration:
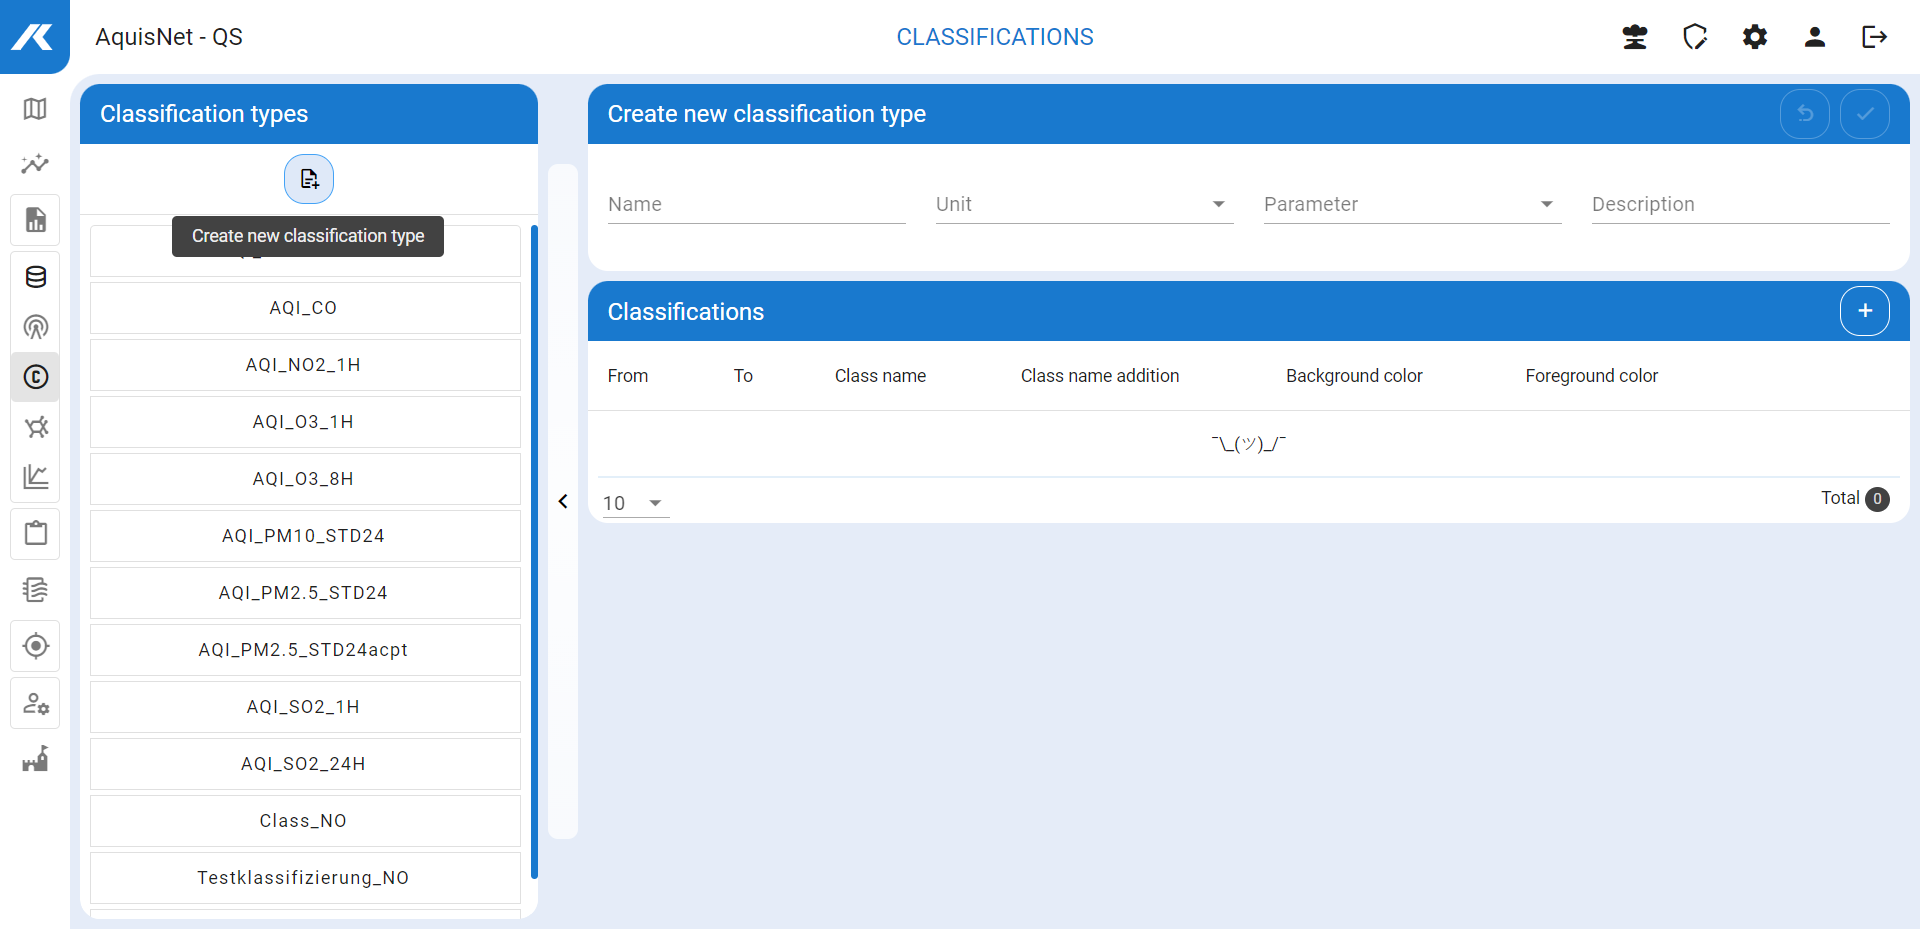
To manage classification types with their classifications,
▪click the link Data management > Classifications in the navigation bar.
The available classification types and their classifications are displayed in the left-hand bar:
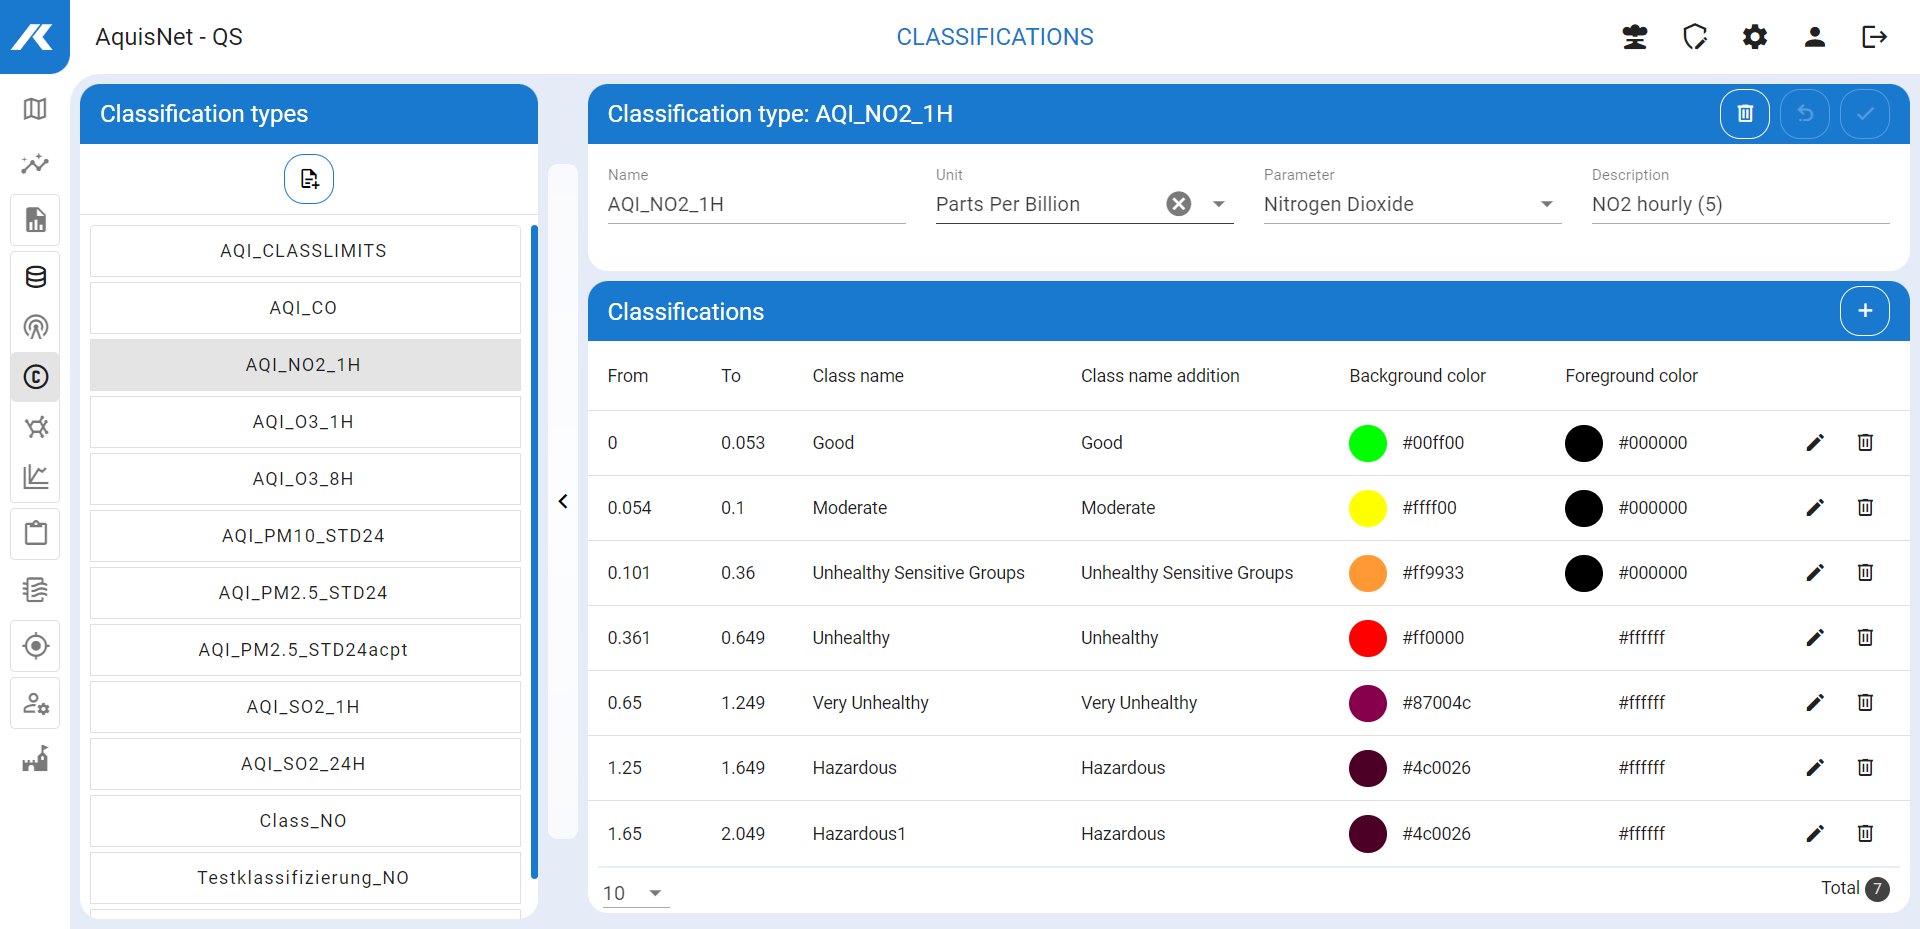
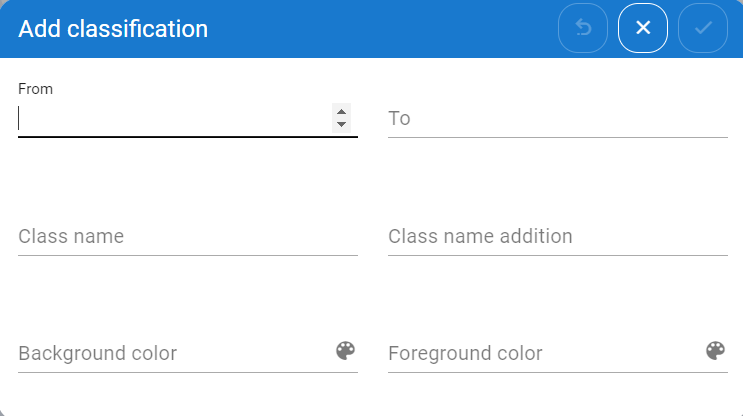
▪Here you can create new classifications, edit and delete existing ones.