AquisNet DMO

|
Inserting/editing a text element |
Scroll
 | |
|
The property dialog appears automatically when you insert a text element; the text (label) tab contains all data that can be used to control the layout of the graph text element.
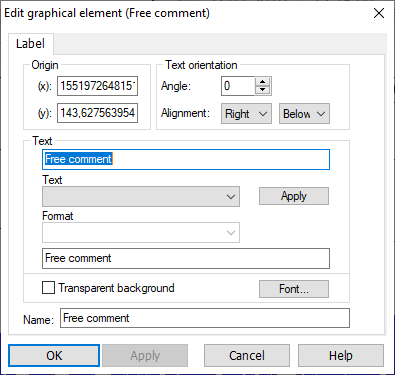
▪Origin:
▪This section contains the position and original coordinates of the graphical text element. You can enter here other coordinates manually.
The graphical text element will be shifted according to your definition.
▪Text orientation (section):
▪Angle: Specify the angle (in degrees) of the text in this field. 0 degree corresponds to a horizontal text orientation. The text will be rotated clockwise around its end point by the specified angle (at 180° the text will be upside down).
▪Horizontal alignment selection box: Sets the origin point of the text in x-direction. Possible settings are right alignment, centred and left alignment.
▪Vertical alignment selection box: Sets the origin point of the text in y-direction. The following entries are possible: above, central and below.
An example: "right above" means that the origin point of the text is in the bottom left corner of the text (i.e. the text is oriented to the top right).
▪Text entry (section):
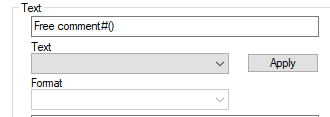
▪In the text box of the section you can enter an own text; such a text can also be combined for example with punctuation marks and the variables described below.
▪In the Text variables list box you will find a lot of time series specific (for example time series name or station name) or preconfigured variables (operator, place of creation) that can be inserted into the text.
▪Here you can display for example the Axis time range as text element. To do so, select the variables first time stamp of the axis and last time stamp of the axis.
All variables with time data can be specified even more exactly:
▪Select in the now active Formatting combo box the date format from the list or enter it manually.
Use the WINDOWS default:
▪T: one-digit date (without leading zero; e.g. 1),
▪TT: two-digit date (with leading zero; e.g. 01),
▪TTT: three-digit abbreviation of the weekday (e.g. Mon),
▪TTTT: long name of weekday (e.g. Monday),
▪M: one-digit month (without leading zero; e.g. 1),
▪MM: two-digit month (with leading zero; e.g. 01),
▪MMM: three-digit abbreviation of the month (e.g. Feb),
▪MMMM: long name of month (e.g. February),
▪YY: two-digit year (with leading zero; e.g. 01),
▪YYYY: four-digit year (e.g. 2001).
Note: When opening the dialog, no date format is yet selected. When selecting a text variable with date format repeatedly, the format selected last will be offered.
▪Select the desired variable from the drop-down list,
▪check whether you have defined the text element as desired using the display box (highlighted in grey), displaying the plain text inserted as element into the graph, and
▪finally click the [Accept] button.
The chosen text variable will be inserted into the text (see Text entry box where the variable is displayed (can be identified by the hash; example: #(time series name) or for formats with time specification: #(start time).
Note: You shouldn’t make any further entries within the variable; the variable contents shouldn’t be changed. The program may not be able to identify them if they have been changed.
When clicking the [Font] button, you will get the usual dialog for font selection and its properties, as known from WINDOWS programs.
For the Operator and Place of creation entries of the Text variables drop-down list box, the respective variables are read in from the aquisnet.ini initialisation file ([Report_Configuration] section, InstAdministration and InstLocation entries).
In addition to the axis time ranges, you can display for example also the time stamp of the first, the last or the current value of the time series as text element.