AquisNet DMO

|
The control bar |
Scroll
 | |
|
Using the control bar, you can display the plausibilised values of an import time series. The bar displayed for this purpose informs you using markings about the time stamp(s) at which values were plausibilised.
▪In the Graph window, select the ![]() icon from the toolbar.
icon from the toolbar.
Use the arrow button next to the icon to open the following drop-down menu:
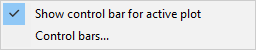
▪Select the Control bar entry.
If more than one time series is loaded in the graph, most functions will cause a dialog to be opened first where you can specify (by checking the box in front of the time series entry) for which time series you want to activate the additional information.
In the graphical representation of the selected time series, you now see the control bar(s) below the x-axis, which will inform you about the plausibilised values of the displayed time series using marks.
▪To hide a bar, open the context menu again and select the Control bar entry once more.
▪In the Display control bar selection dialog, check the box of the time series whose control bar you want to hide and confirm with [Accept] and then with [OK].
The selected bar is hidden now.