AquisNet DMO

|
Functions for the graph |
Scroll
 | |
|
The main menu item Graph offers you the possibility to select graph presets and display options and to open the graph display.
Graph default settings for time series definitions
In order to display time series clearly, you have the option of specifying a format for each time series definition by means of standard settings, which is used for the graph display.
Select the Graph > Normal view default settings > Time series definition default settings menu item in the main menu.
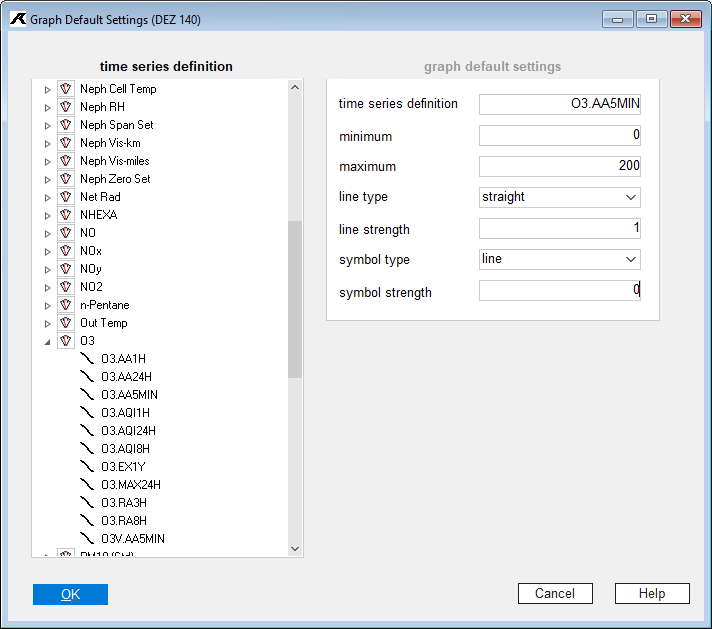
In the selection list on the left, you will find all the parameters created in the system; in the level below, you will find the time series definitions. Time series definitions with an existing configuration are shown as follows:
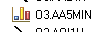
Time series definitions that have not yet been configured are displayed as follows.

Make default settings for the graph
The following settings determine the format in which a time series is displayed later:
▪Minimum
Used to set the lower limit of the displayed measured values.
▪Maximum
Used to set the upper limit of the displayed measured values.
▪Line type
Selecting a type from the selection list
▪Line width
▪Symbol type
Display of the measured values by a specific symbol.
▪Symbol strength
Setting the symbol in the display.
When you have finished the settings,
▪close the window by clicking the [OK] button.
▪You return to the time series browser.
Colour order
In addition to the ZRD-dependent settings, colour assignments can be defined for the time series in the time series selection window. Unless otherwise configured for the time series definition, the various plots in a graph display receive the colours in the order defined here. According to the following picture, the line of the first time series will become blue, the line of the second time series red. Etc.
This ensures unique identification of each time series in the graph report.
▪In the main menu, select the Graph > Normal view default settings > Colour iteration menu item.
You will receive the following dialog.
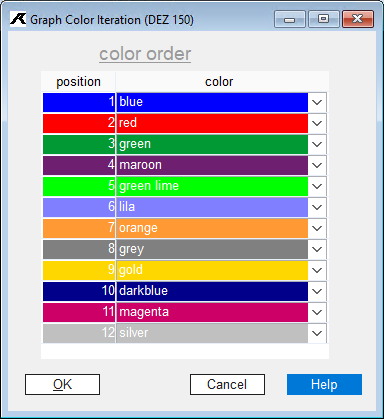
Set colour order
You can assign a colour to each of the individual position numbers, which ensures the distinguishability of time series in a graph.
▪To do this, select a colour from the colour selection list in the corresponding line.
If you want to add a new row,
▪open the context menu with the right mouse button and
▪select the Add new row function.
The new last row is added at the end of the list.
▪Click on the new row and set its colour.
If you want to delete the last row of entries,
▪select the last entry in the list and
▪open the context menu,
▪to select the Delete last row function.
If you want to close the colour definition dialog,
▪click the [OK] button.
Confirm the control message to complete the process.
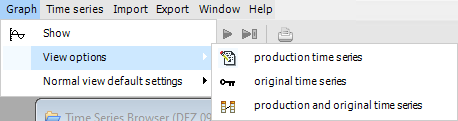
View options
You can display production time series, original time series or both in graph and/or table.
▪Click the menu item Graph > View options in the main menu.
▪Select one of the submenu entries to specify the time series type to be displayed.