AquisNet DMO

|
Filter time series graph using an error code group |
Scroll
 | |
|
You can adjust the display of the time series in the graph so that only values with certain error code groups are displayed.
To filter time series by error codes,
▪first select the Graph settings > Filter graph with error codes entry in the context menu.
▪The Filter graph with error codes dialog opens:
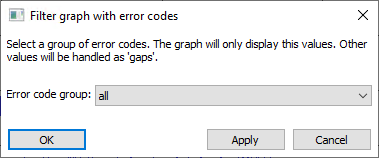
This dialog lists all error code groups created in the system using a drop-down list box.
▪Select an error code group:
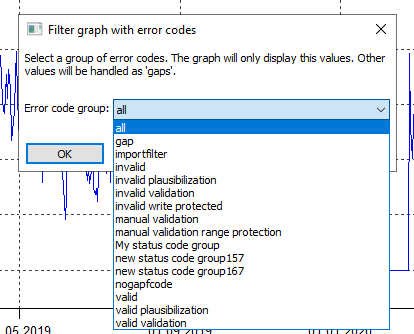
Drop-down list box for the selection
▪Confirm with [Accept] and with [Ok].
After confirming the selection, only the values that have an error code according to the preselected error code group are displayed in the graph. The result can be – depending on the error code group – a completely changed graph.
Note: The last selection of an error code group is saved in your user profile. The next time the graph is opened, this group is also used for filtering.