AquisNet DMO

|
Inserting a graphical element |
Scroll
 | |
|
To insert a new graphical element,
▪click the ![]() button.
button.
▪alternatively, you can open the Insert graphical element context menu entry.
The Insert graphical element dialog opens:
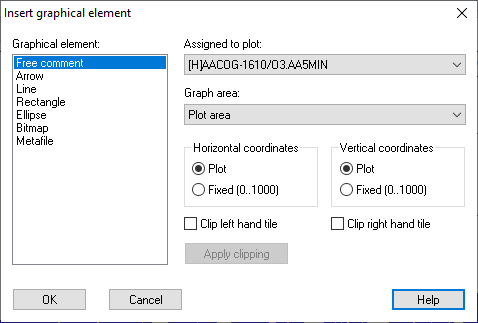
The Plots list box shows all time series (plots) contained in the graph.
▪Choose the time series to which the graphical element should be added.
▪Select the element to be added to the time series from the Graphical element list box.
Using the radio buttons in the Assigned to section you specify the connection of the graphical element with the time series:
▪Axis (horizontal/vertical):The graphical element is connected to the plot (the x- as well as the y-coordinates of the graphical element correspond to the plot coordinates), i.e. the graphical element is always exactly at the same position relatively to the plot. This means that the graphical element is moved along the axes when the display is enlarged or reduced or when the plot is moved.
▪Axis (horizontal): The x-direction of the graphical element depends on the plot whereas the y-direction remains constant (coordinates 0 to 1000). That means, it shifts only in x-direction, not in y-direction.
▪Axis (vertical): The y-direction of the graphical element depends on the plot whereas the x-direction remains constant (coordinates 0 to 1000). That means, it shifts only in y-direction, not in x-direction.
▪None: The graphical element remains constant in both directions, irrespective of the plot (both coordinates between 0 -1000). It therefore does not change its position even when enlarged or reduced or moved along the axes.
▪Header: The graphical element is inserted into the header. If a header does not yet exist, it will be created. Both coordinates range from 0 to 1000.
▪Footer: The graphical element is inserted into the footer. If a footer does not yet exist, it will be created. Both coordinates range from 0 to 1000.
Note: The user defined graphical elements in the header and footer are assigned to the time series. If a time series is deleted from the graph, the graphical elements belonging to that time series will also be deleted from header and footer!
After having made these specifications,
▪confirm with [OK].
The dialog closes; the mouse pointer changes to a cross ([+]).
▪Click the left mouse button to define the start point of the graphical element within the graph window.
▪Hold the left mouse button down and drag the mouse in any direction in order to define the end point of the graphical element.
While you are dragging, the graphical element and the surrounding rectangle are already shown.
▪When releasing the left mouse button, the end point of the graphical element is defined and the insertion process is completed.
▪When inserting a text element, the edit window will be opened immediately on clicking the left mouse button. In this window you enter your text and specify its layout and formatting.