AquisNet SYS/REP (NEW)

|
Visualisation of your data |
Scroll
 | |
|
Under the Graphing link you will find all functions you can use to evaluate your air quality data.
This powerful tool provides you with various types of analyses. The simple operation enables intuitive handling and fast working with this area of functionality.
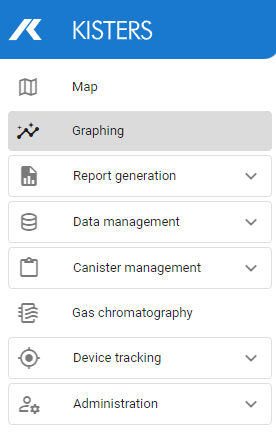
The visualisation of your data comprises the following functions: